Tor Metrics - Google Summer of Code 2010

Although it has been a while since GSoC ended, I want to give a quick run-down of my project and how everything went over the summer. The plan was to migrate the Tor metrics portal from the file based system to a database driven one. This allows us to have a more dynamic website and a better interface to derive our statistics and visuals from. I spent most of my time designing the database schema (which had to be carefully optimized due to the amount of data we have), and the remainder of the time working on things such as dynamic graphs and migrating the website to Java Server Pages. Thankfully, I finished almost everything I had planned to do, and it seems as though my work this summer is being put to good use! A significant amount of my metrics code has been merged, which is certainly a good feeling.
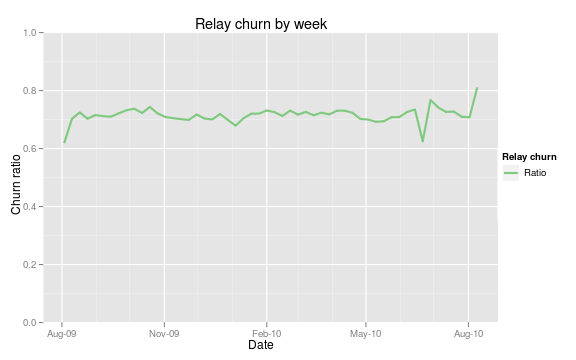
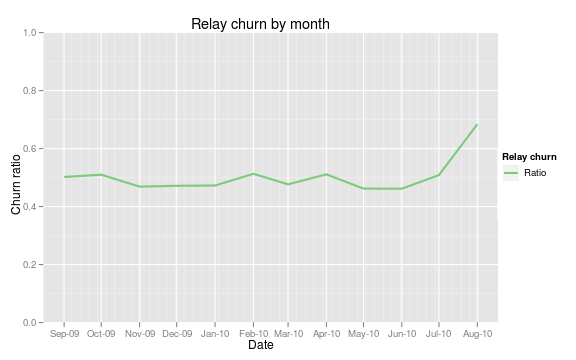
While I did not have any specific research questions in mind, I was able to uncover some interesting things by exploring the wealth of data in front of me. One of the things I promised to deliver was relay churn - a statistic to show the stability of the network. The Y axis, or the "churn ratio" is rather abstract, but it tells us the percentage of unique router fingerprints from one cohort that appear in the following cohort. Unfortunately, it requires a significant amount of database power to produce (large table scans are necessary when grouping routers by time period - the smaller the interval the longer the operation takes). However, the logic is clear and is easily accomplished from the database. The churn graphs may find their way onto the website, but the underlying processes may need to be optimized further. Either way, a database system ought to open a few doors for us in regards to some of the interesting things we can easily explore. See some of the churn graphs here, and here.
In addition to the back-end and database work, I explored ggplot2 and the R language - the tools used to generate the graphs on the metrics portal. Currently, R communicates with the database to generate graphs on demand (I settled on a Postgres driver for R which was part of GSoC 2008). The goal was to make the graphs parametizable so a user can request a custom or unique graph. The graphs are then served from Rserve and Apache Tomcat. A few examples of the parametizable graphs are currently live on the metrics website which were implemented by Karsten.
Congratulations to the rest of the GSoC'ers John, Kory, and Harry for their successful projects. I want to give a big thank you to @KarstenLoesing for being such a great guide for my foray into the Tor Project and open-source development. It has been a great learning experience. Many thanks to Tor and Google for the opportunity!
Comments
Please note that the comment area below has been archived.
Hello, what about a network
Hello,
what about a network card with tor on a lower layer and with a chip or something?
Frankly, TOR is useless
Frankly, TOR is useless since by now many websites are employing measures against it. RIP TOR.
It was a nice experiment, though.
And it is still a great way to catch stupid criminals who think they can hide behind TOR. :)
IM install this program 1
IM install this program
1 dont work in IEXLPLORER
2 dont work in firefox (and can not install "buttonx"
3 dont work in others program thats uses socks5
4 polipo dont work...
this program make looss my time .. really i hate the guys that create incomplete programs .,, very bad..
Where can I get the TOR
Where can I get the TOR alpha builds?
I guess it is missing from the new website
Chris
It's Tor not TOR damnit! ;p
It's Tor not TOR damnit! ;p
I haven't used TOR so can I
I haven't used TOR so can I get more details about it? Are you sure it is useless?
Please make it clear to me....
If you need any help regarding "Sales territory mapping" then we will be glad to serve you...
http://www.indicia-geomarketing.com